Relation: A relation is simply a set of ordered pairs.
The first elements in the ordered pairs (the x-values), form the domain. The second elements in the ordered pairs (the y-values), form the range. Only the elements "used" by the relation constitute the range.
This mapping shows a relation from set A into set B.
This relation consists of the ordered pairs
(1,2), (3,2), (5,7), and (9,8).
• The domain is the set {1, 3, 5, 9}
• The range is the set {2, 7, 8}.
(Notice that 3, 5 and 6 are not part of the range.)
• The range is the dependent variable.
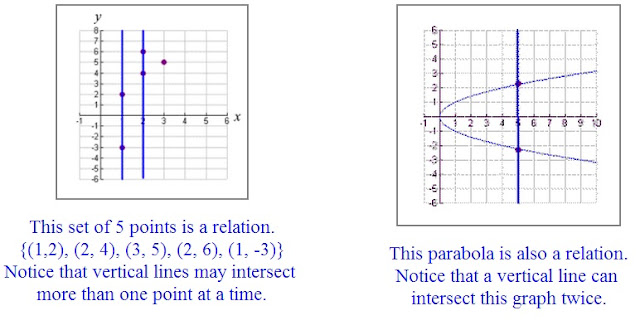
The following are examples of relations. Notice that a vertical line may intersect a relation in more than one location.

Function: A function is a set of ordered pairs in which each x-element has only ONE y-element associated with it.
The relations shown above are NOT functions because certain x-elements are paired with more than one unique y-element.
The first relation shown above can be altered to become a function by removing the ordered pairs where the x-coordinate is repeated. It will not matter which "repeat" is removed.
function: {(1,2), (2,4), (3,5)}
The graph below shows that a vertical line now intersects only ONE point in our new function.
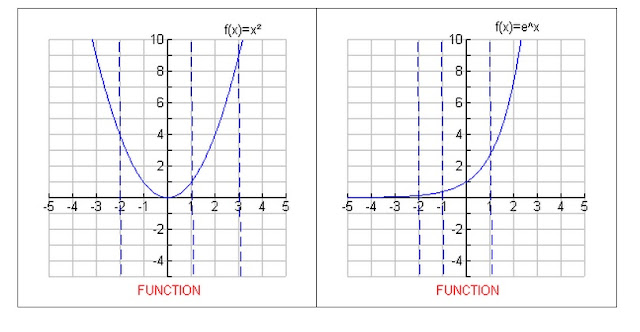
Vertical line test: each vertical line drawn through the graph will intersect a function in only one location.

Evaluating a Functions
Replace (
substitute) its variable with a given number or expression.
Like in this example:
Types of a Functions
1. Linear Functions
The linear function is popular in economics. It is attractive because it is simple and easy to handle mathematically. It has many important applications.
Linear functions are those whose graph is a straight line.
A linear function has the following form
y = f(x) = a + bx
A linear function has one independent variable and one dependent variable. The independent variable is x and the dependent variable is y.
a is the constant term or the y intercept. It is the value of the dependent variable when x = 0.
b is the coefficient of the independent variable. It is also known as the slope and gives the rate of change of the dependent variable.
Graphing a linear function
To graph a linear function:
1. Find 2 points which satisfy the equation
2. Plot them
3. Connect the points with a straight line
Example:
y = 25 + 5x
let x = 1
then
y = 25 + 5(1) = 30
let x = 3
then
y = 25 + 5(3) = 40
2. Quadratic Functions
The general technique for graphing quadratics is the same as for graphing linear equations. However, since quadratics graph as curvy lines (called "parabolas"), rather than the straight lines generated by linear equations, there are some additional considerations.
The most basic quadratic is y = x2. When you graphed straight lines, you only needed two points to graph your line, though you generally plotted three or more points just to be on the safe side. However, three points will almost certainly not be enough points for graphing a quadratic, at least not until you arevery experienced. For example, suppose a student computes these three points:
3. Piecewise-Defined Functions
A piecewise-defined is a fraction defined by two or more equations over a specified domain.
Rational Functions
A Rational is a quotient of two polynomial functions that is, a function of the form.
How to Graph a Rational Function
1. SImplify the equation, if possible
2. Find the y-intercepts & x-intercepts of the graph, if any.
3. Determine the vertical & horizontal asymptotes of the graph.
4. Plot additional Points.
Vertical Asymptotes
x-->a "x approches a"
"x assumes values very close to a"
 |
The line
x=a is a
vertical asymptote of the graph of f if :
f(x)= +
∞ or f(x)= -∞
Horizontal Asymptote

The line
y=b is a
horizontal asymptote of the graph of f if
f(x) = b as x = +
∞ or x =-∞
If degree of N(x) = degree of D(x)
then y=an/bn (ratio of leading coefficient) is horizontal asymptote.
If degree of N(x)<degree of D(x), then y=0 (x-axis) is horizontal asymptote.
If degree of N(x)>degree of D(x), then the graph has no horizontal asymptote.
Combining Functions
Inverse Funtions
If f & g are two functions such that
f(g(x))=x (indentity functions) &
g(f(x))=x there f & g are inverse functions of each other
If g is the inverse of the given function f, then we denote g by f^-1 .
How to find the inverse of y=f(x)
1. replace f(x) by y.
2. interchange x & y
3. solve for y in terms of x
the resulting function is the inverse function y=f^-1(x)
(c)regentsprep, mathisfun


