Saturday, October 5, 2013

Linear Systems


Systems in Linear Equation or Linear Systems 


Methods for solving Linear Systems:
    1.   Elimination Method
    2.  Substitution Method
    3.  Solution by Determinants (Cramer’s Rule)


Tuesday, October 1, 2013

Oblique Triangle

Oblique Triangles:
            An oblique triangle is any triangle that is not a right triangle. It could be an acute triangle (all threee angles of the triangle are less than right angles) or it could be an obtuse triangle (one of the three angles is greater than a right angle). Actually, for the purposes of trigonometry, the class of "oblique triangles" might just as well include right triangles, too. Then the study of oblique triangles is really the study of all triangles.
รจ No right angle

Solution
 a.)     Law of sines
 b.)  Law of cosines


EXAMPLES:

1.)

2.)


3.) 

Tuesday, September 24, 2013

Logarithmic Functions

Logarithmic Functions

The logarithm function is defined by the equation 
    "logarithm of x base a"
    domain{x|x>0}  range: R
"y is the number to which a must be raised to give x"

Logarithm is another name for exponent

Note:
When a=10 y=logax = 
log10x = logx (Common or Briggsian Logarithm)
When a=e =2.72, y = logex = lnx (Natural or Napierian Logarithm)


The Basic Properties of Logs
1. logb(xy) = logbx + logby.
2. logb(x/y) = logbx - logby.
3. logb(xn) = n logbx.               
4. logbx = logax / logab.          


Examples:


Tuesday, September 17, 2013

Exponential Functions

Exponential Functions

The exponential function is the function defined by the equation 
f(x)=ax  or y = ax     a>, a is not equal to 1 , x is any Real No.,
a is called the base (number that is to be multiplied by itself)
x is called the exponent (indicated how many times the base to be multiplied by itself)
Graph of y=ax    
                       if a>1                                               if 0<a<1


Examples:


1.)


2.)
3.)
4.)
Properties of y=ax
Let u,v element of Real Numbers


(c)Take notes on College Algebra, Prof.: Mr. Ruben "Jun" De Armas

Wednesday, September 4, 2013

Functions

Relation:  A relation is simply a set of ordered pairs.


The first elements in the ordered pairs (the x-values), form the domain.  The second elements in the ordered pairs (the y-values), form the range.  Only the elements "used" by the relation constitute the range.


This mapping shows a relation from set A into set B.
This relation consists of the ordered pairs
(1,2), (3,2), (5,7), and (9,8).

•  The domain is the set {1, 3, 5, 9}   
•  The range is the set {2, 7, 8}.   
   (Notice that 3, 5 and 6 are not part of the range.)
•  The range is the dependent variable.


The following are examples of relations.  Notice that a vertical line may intersect a relation in more than one location.


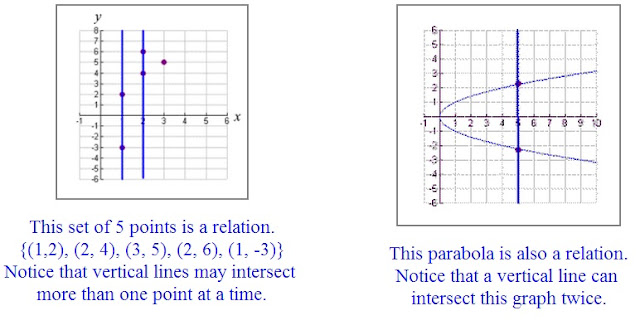
Function:  A function is a set of ordered pairs in which each x-element has only ONE y-element associated with it.

The relations shown above are NOT functions because certain x-elements are paired with more than one unique y-element.

The first relation shown above can be altered to become a function by removing the ordered pairs where the x-coordinate is repeated.  It will not matter which "repeat" is removed.   
function:  {(1,2), (2,4), (3,5)}

The graph below shows that a vertical line now intersects only ONE point in our new function.


Vertical line test: each vertical line drawn through the graph will intersect a function in only one location.


Evaluating a Functions
To evaluate a function is to:
Replace (substitute) its variable with a given number or expression.
Like in this example:


Types of a Functions

1. Linear Functions
The linear function is popular in economics. It is attractive because it is simple and easy to handle mathematically. It has many important applications.
Linear functions are those whose graph is a straight line.
A linear function has the following form
y = f(x) = a + bx
A linear function has one independent variable and one dependent variable. The independent variable is x and the dependent variable is y.
a is the constant term or the y intercept. It is the value of the dependent variable when x = 0.
b is the coefficient of the independent variable. It is also known as the slope and gives the rate of change of the dependent variable.

Graphing a linear function
To graph a linear function:
1. Find 2 points which satisfy the equation
2. Plot them
3. Connect the points with a straight line
Example:
y = 25 + 5x
let x = 1
then
y = 25 + 5(1) = 30
let x = 3
then
y = 25 + 5(3) = 40

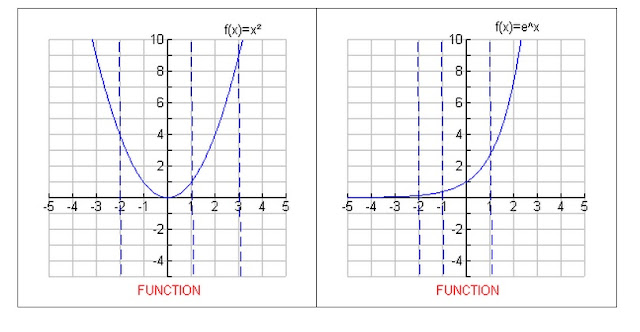
2. Quadratic Functions


    The general technique for graphing quadratics is the same as for graphing linear equations. However, since quadratics graph as curvy lines (called "parabolas"), rather than the straight lines generated by linear equations, there are some additional considerations.
    The most basic quadratic is y = x2. When you graphed straight lines, you only needed two points to graph your line, though you generally plotted three or more points just to be on the safe side. However, three points will almost certainly not be enough points for graphing a quadratic, at least not until you arevery experienced. For example, suppose a student computes these three points:


3. Piecewise-Defined Functions
A piecewise-defined is a fraction defined by two or more equations over a specified domain.


Rational Functions
A Rational is a quotient of two polynomial functions that is, a function of the form.


How to Graph a Rational Function
1. SImplify the equation, if possible
2. Find the y-intercepts & x-intercepts of the graph, if any.
3. Determine the vertical & horizontal asymptotes of the graph.
4. Plot additional Points.

Vertical Asymptotes
x-->a "x approches a"
"x assumes values very close to a"
The line x=a is a vertical asymptote of the graph of f if :
f(x)= + or f(x)= -

Horizontal Asymptote


The line y=b is a horizontal asymptote of the graph of f if
f(x) = b     as x = +∞    or x =-

If degree of N(x) = degree of D(x)
then y=an/bn (ratio of leading coefficient) is horizontal asymptote.
If degree of N(x)<degree of D(x), then y=0 (x-axis) is horizontal asymptote.
If degree of N(x)>degree of D(x), then the graph has no horizontal asymptote.


Combining Functions


Inverse Funtions
If f & g are two functions such that
f(g(x))=x (indentity functions) &
g(f(x))=x there  f & g are inverse functions of each other

If g is the inverse of the given function f, then we denote g by f^-1 .
How to find the inverse of y=f(x)
1. replace f(x) by y.
2. interchange x & y
3. solve for y in terms of x
the resulting function is the inverse function y=f^-1(x)


(c)regentsprep, mathisfun

Monday, August 19, 2013

Parallel and Perpendicular Lines

Parallel and Perpendicular Lines

Coordinates

graph with point (12,5)
I will be using Cartesian Coordinates, where you mark a point on a graph by how far along and how far up it is.
Example: The point (12,5) is
12 units along, and 5 units up.


Slope-Intercept Form


You should also know about the equation of a line:
y = mx + b


Parallel Lines

How do you know if two lines are parallel?


Their slopes are the same!

Example:

Find the equation of the line that is:
  • parallel to y = 2x + 1
  • and passes though the point (5,4)
graph
The slope of y=2x+1 is: 2
The parallel line must have the same slope!

Let us put that in the "point-slope" equation of a line:
y - y1 = 2(x - x1)
And now put in the point (5,4):
y - 4 = 2(x - 5)
And that is a good answer!

But let's also put it in the "slope-intercept (y = mx + b)" form:
y - 4 = 2x - 10
y = 2x - 6

Vertical Lines

Be careful! They may be the same line (just with a different equation), and so would not really be parallel.

How to know if they are really the same line? Check their y-intercepts.

But this does not work for vertical lines ... I explain why at the end

Not The Same Line

Example: is y=3x+2 parallel to y-2=3x ?

For y=3x+2: the slope is 3, and y-intercept is 2
For y-2=3x: the slope is 3, and y-intercept is 2
In fact they are the same line and so are not parallel

Perpendicular Lines

Two lines are Perpendicular if they meet at a right angle (90°).
How do you know if two lines are perpendicular?
When you multiply their slopes, you get -1
This will show you what I mean:
graph vertical line
These two lines are perpendicular:
LineSlope
y = 2x + 12
y = -0.5x + 4-0.5
If we multiply the two slopes we get:
2 × (-0.5) = -1

Using It

OK, if we call the two slopes m1 and m2 then we could write:
m1m2 = -1
Which could also be:
m1 = -1/m2orm2 = -1/m1
So, to go from a slope to its perpendicular:
  • calculate 1/slope (the reciprocal)
  • and then the negative of that
In other words the negative of the reciprocal.

Example:

Find the equation of the line that is
  • perpendicular to y = -4x + 10
  • and passes though the point (7,2)
graph
The slope of y=-4x+10 is: -4
The negative reciprocal of that slope is:
m = -1=1
-44
So the perpendicular line will have a slope of 1/4:
y - y1 = (1/4)(x - x1)
And now put in the point (7,2):
y - 2 = (1/4)(x - 7)
And that is a good answer!

But let's also put it in "y=mx+b" form:
y - 2 = x/4 - 7/4
y = x/4 + 1/4

Vertical Lines

The previous methods work nicely except for one particular case: a vertical line:
graph vertical line
In that case the gradient is undefined (because you cannot divide by 0):
m =
yA - yB
xA - xB
=
4 - 1
2 - 2
=
3
0
= undefined
So just rely on the fact that:
  • a vertical line is parallel to another vertical line.
  • a vertical line is perpendicular to a horizontal line (and vice versa).


(c)http://www.mathsisfun.com


Saturday, August 17, 2013

Multiple-Angle and Product-to-Sum Formulas

Double-Angle Formulas


Power-Reducing Formulas


Half-Angle Formulas
Product-to-Sum Formulas


Sum-to-Product Formulas